A Web3 crypto digital fund can appear diversified because its positions have different names and interfaces. But a lending position, a liquidity position, and a staking receipt may ultimately depend on the same collateral, bridge, or set of administrators. The number of applications is not a reliable count of independent risks.
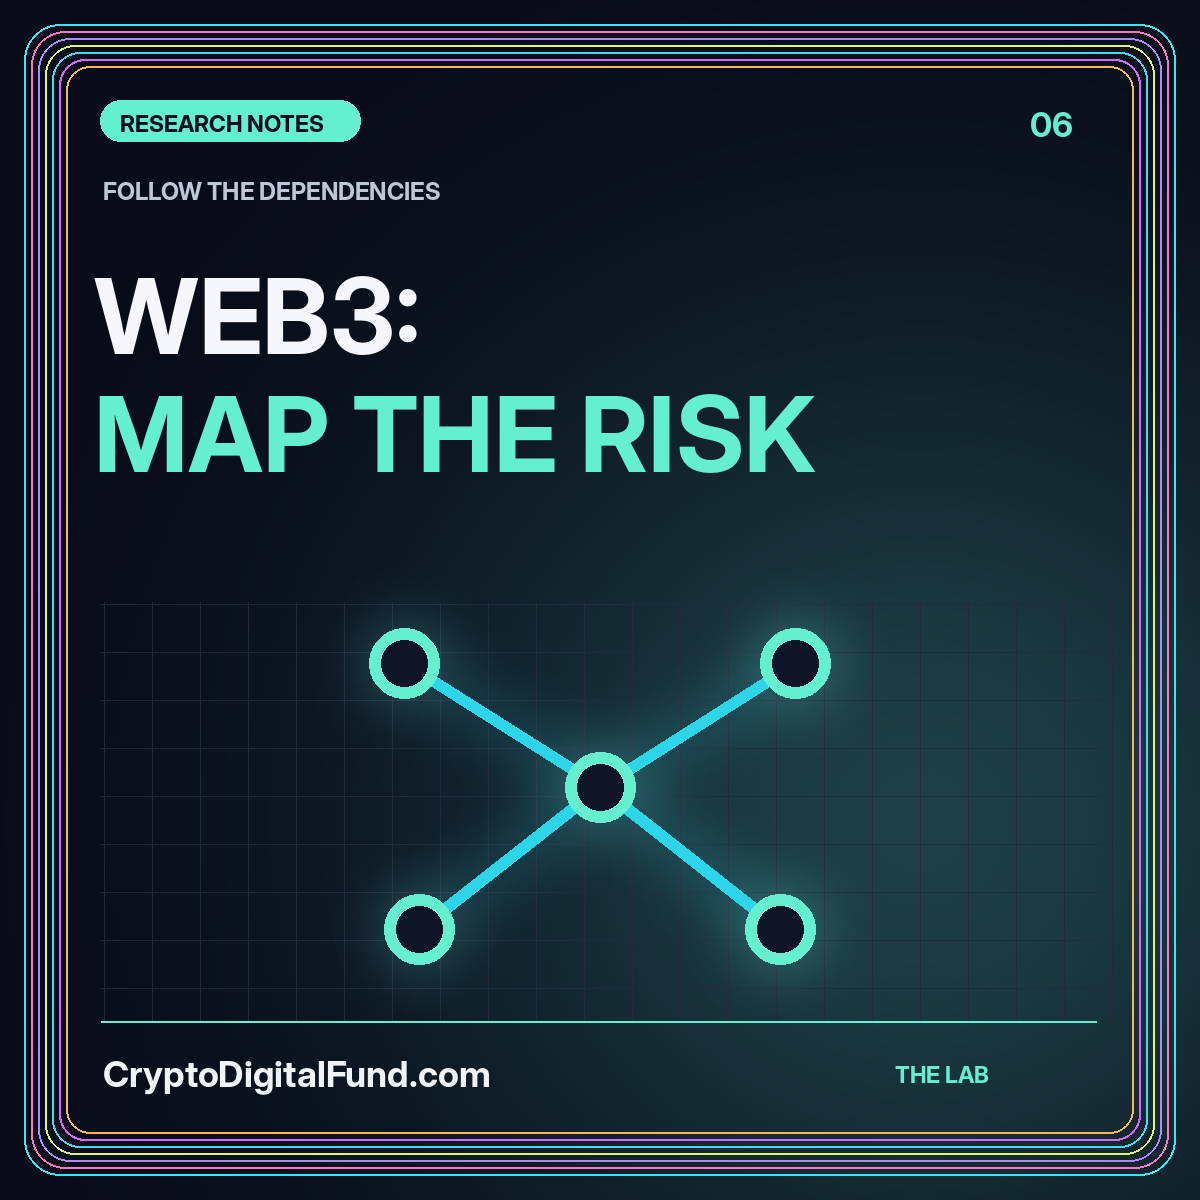
A dependency map offers a clearer starting point. It traces what must work for a position to retain value and for its holder to exit. The map is not a security audit or a loss forecast. It is a structured way to discover missing information before treating several layers of activity as a simple investment product.
1. Begin with the final claim
Write down exactly what the holder receives. It might be a native token, a wrapped token, a receipt for a pool position, a governance token, or shares in a vehicle. Use the actual claim rather than a general description such as “DeFi yield.”
Now trace backward. Which asset entered the first application? What new claim was issued? Was that claim used somewhere else? Continue until the relationship between the original asset and the final position can be explained in ordinary language.
The Web3 Crypto Digital Fund topic page organizes this investigation around dependencies rather than rankings. If the ownership chain cannot be explained, pause the analysis at the unknown step. Naming the uncertainty is more useful than drawing a continuous arrow that implies a verified connection where none has been established.
2. Put the main dependency types on the map
Use separate boxes for the underlying network, the application contracts, pricing inputs, administrators, custody arrangements, and exit venues. Include a bridge whenever an asset or message crosses between systems. Do not omit a component just because users rarely see it in the interface.
Ethereum.org's introduction to blockchain bridges identifies risks associated with smart contracts and technology, along with additional trust concerns in bridges that depend on operators. That is a useful reminder that moving an asset between environments can introduce a new relationship rather than merely change its location on a screen.
For each box, record what evidence supports its role. A diagram based on verified documentation is different from one inferred from marketing language. Use a visible question mark where the relevant mechanism or controlling party has not been established.
3. Distinguish ownership control from information flow
Some dependencies move or hold assets. Others supply information used to make decisions. A price input, for example, can affect how an application interprets collateral without itself holding that collateral. Both types belong in the map, but they should not be drawn as the same kind of relationship.
Label what each connection does
Use solid arrows for asset movements and dashed arrows for information or permissions. Label the arrows with the actual action: deposit, issue, redeem, update, or authorize. Avoid vague terms such as “powered by” that do not explain what the relationship does.
Then ask what happens if an information source is unavailable, delayed, or inconsistent. Do not invent a failure response. Locate the documented behavior and record any ambiguity. The point of the map is to turn technical terminology into questions that can be answered, not to create an impressive illustration without operational meaning.
4. Identify shared components across positions
Suppose an illustrative research portfolio contains three positions with different application names. Each ultimately relies on the same wrapped asset. All three should connect to that asset on the same map. The visual overlap immediately reveals a dependency that a holdings list could hide.
Repeat the exercise for administrators, pricing sources, custody providers, and exit venues. Where the relationships are only suspected, mark them as unverified. Do not claim that every shared dependency creates the same magnitude of risk; the consequences depend on the design and exposure.
A useful question is: “Which single unresolved issue would force me to reconsider more than one position?” This reframes diversification as a practical research problem. You do not need a perfect statistical model to recognize that multiple apparently distinct strategies might all depend on one mechanism working as intended.
5. Separate gross rewards from economic sources
An advertised reward percentage is incomplete without an explanation of who pays and why. Investigate whether the return being described comes from borrower payments, transaction activity, token distributions, or another source. These mechanisms should not be combined into a single label without explanation.
Ask how the reward is measured and whether the advertised number includes fees, changing token prices, or temporary incentives. A reward paid in a different asset adds another valuation question. A high displayed rate can be a starting point for investigation, but it is not evidence that the overall strategy is sustainable.
Create one line per economic source in the research file. Describe what would need to remain true for that source to continue. This makes it easier to distinguish a strategy's operating logic from a promotional estimate that may depend on conditions outside the holder's control.
6. Trace the exit in reverse
A diagram of deposits is only half a dependency map. Draw the path back to the asset or currency the holder ultimately needs. List the permissions, markets, redemption mechanisms, and transaction steps required along that path.
In an illustrative multilayer position, an exit might require unwinding an application receipt, redeeming another claim, moving assets across environments, and completing a sale. The exact sequence is product-specific. Do not assume every intermediate step remains available merely because the final asset has an active market somewhere.
For each step, ask what evidence supports the expected timing and cost. Label estimates clearly and test an inconvenient scenario in which one route is unavailable. A second interface is not necessarily an independent fallback when both interfaces rely on the same contracts or service providers.
7. Read security evidence within its scope
A security review can provide valuable information, but the research question is what it actually examined. Record the version, date, components, assumptions, and unresolved findings. Then compare that scope with the system currently being considered.
Do not translate “reviewed” into “guaranteed safe.” A later change, a component outside scope, or a different operating arrangement may require separate analysis. Similarly, the absence of a known incident is not a complete measurement of safety.
A useful evidence ledger places each assurance beside the exact claim it supports. For example, a review of one contract should not silently become evidence about every operator and external service connected to it. This discipline keeps a dependency map honest without dismissing useful technical work simply because it cannot eliminate all uncertainty.
8. Turn the map into review triggers
A dependency map becomes actionable when it specifies what would cause another review. Examples include an upgrade, a new administrator, a change in collateral, revised exit rules, or a different source of rewards. The triggers should follow the actual design rather than a generic calendar.
Give each unresolved item an owner in the research process, even if that owner is simply “awaiting provider documentation.” Avoid assigning a confidence score just to fill an empty cell. A clear unknown is often more informative than an arbitrary number.
Compare the map with the Ethereum staking guide and the domain-name portfolio article. Both demonstrate that a digital receipt and its underlying asset can have different operational requirements. The principle applies beyond any one blockchain application.
Conclusion: complexity needs a visible explanation
Web3 research improves when the reader can see the entire ownership and exit chain, not just the final balance displayed by an application. A dependency map helps reveal shared components, unsupported assumptions, and the practical meaning of additional layers.
Use it to ask better questions, not to manufacture a numerical prediction of safety. Explain the origin of rewards, keep review evidence within its scope, and trace the exit all the way back to the asset needed. A strategy that cannot be described clearly should not become convincing merely because its interface is polished.